
Nordic nRF52 BLE – Continuous Data Transmission
I have been playing with one of Nordic’s nRF52 development boards to try and see how much data I can transmit using BLE to a smartphone. While continuous data transmission is not the ideal use case scenario for BLE (which is designed for intermittent usage), there are applications that do require high data rates at times. This is also evident from a very high number of questions posted on BLE forums about the maximum data rate achievable by a peripheral device.
It should be noted that the maximum data rates over such links between a peripheral and central (smartphone) is dependant on the peripheral chip itself i.e. the ones from Texas Instruments and Nordic may have their own limitations as well as smartphones where iOS supports 6 data packets per connection interval while Android seems to support 4 in most cases. Further, the connection interval between events is also variable with iOS supporting 30ms by default. All in all, there are a lot of possible factors that need to be taken care of during the final design of any product using BLE.
I started off by creating a custom service consisting of single data characteristic of size 20 bytes. This is because the MTU size is limited to be 20 so that’s the maximum data payload that can be transmitted in one packet after all the headers and other stuff are taken care of. I was using nRF52 SDK version 0.9.2 and SoftDevice S132. I kept transmitting (send notification) after every BLE_EVT_TX_COMPLETE event so as to have continuous data transmission. On the receiver side, I used an iPhone 6 running iOS 9 and noticed two packets being received in each connection interval. Browsing through the help forums I figured out that S132 v1 can send two packets per interval only. This meant a maximum data rate of 10.67 kbps (on an iPhone with 30ms interval).
The newer SoftDevice S132 v2 (with nRF5 SDK v11.0.0) supports 6 packets per interval and results in a data rate of 32kbps. If the connection interval can be reduced the data rate can be even higher. I have posted a working example using this version on GitHub which demonstrates how to set up a custom service for such continuous transmission. Things change quite quickly with each new release so its best to have a look at the docs in detail. Also, the Nordic developer forum is full of useful information and is also the source from where I found answers to most of the issues I was having with my work.
Useful resources:
Update UITableView when user scrolls to end (Swift)
A very common way of displaying a list of items in an iOS app is using a UITableView which gets its data, typically, from an array that holds the items to be displayed in each cell. If the items to be displayed are fetched with an API call to a web server then it is probably not to a good idea to get hundreds of items from the server in one call and then set up the tableview to display. Even if you do display lots of items, at one point your user will scroll down to the end and (unless you don’t have anything else to show) you will need to make another request to the server to get more data.
It is quite normal to display a limited set of items initially and then fetch more data if the user reaches the end of current set. This behaviour is seen in many apps including both Facebook and Twitter and is a seamless experience such that the user often doesn’t notice when more items are fetched and added to the tableview as he or she scrolls down. So how exactly does this work?
It is actually very straightforward. UITableView conforms to UIScrollViewDelegate so all you need to do is implement the scrollViewDidScroll: delegate where you’d detect the current scroll position in the UITableView. If the user reaches the point where you are running out of items to be displayed you will make a request to get more data. Just make sure that when you do make a request or are updating data, set a flag of some kind so that any further scroll doesn’t result in repeated calls.
Here’s the code snippet I have used.
let threshold = 100.0 // threshold from bottom of tableView
var isLoadingMore = false // flag

func scrollViewDidScroll(scrollView: UIScrollView) {
let contentOffset = scrollView.contentOffset.y
let maximumOffset = scrollView.contentSize.height - scrollView.frame.size.height;

if !isLoadingMore && (maximumOffset - contentOffset <= threshold) {
// Get more data - API call
self.isLoadingMore = true

// Update UI
dispatch_async(dispatch_get_main_queue()) {
tableView.reloadData()
self.isLoadingMore = false
}
}
}

Interfacing TI SensorTag with iOS Devices using Swift
In this post, I will show how to connect an iOS device (with Bluetooth 4.0) to the SensorTag, read data from the sensors and display it on the screen. For the purpose of this tutorial you will need:
- An iOS device with Bluetooth 4.0
- iOS Developer Account
- Texas Instruments SensorTag
- Xcode 6.1
The SensorTag from Texas Instruments is a fantastic little kit with multiple sensors that transmit data via Bluetooth Low Energy. It has six sensors but I will be showing the use of only one as an example here. You can find my complete project with code for other sensors on GitHub.
Getting Started
Fire up Xcode and start a new project with Single View Application template.
Setting up the View (or storyboard)
I am not going to use the storyboard here because I like setting up my view in code. But if you prefer the storyboard method feel free to do so.
We need three UILabels:
- titleLabel – This will be used as the label for displaying the title
- statusLabel – Just below the titleLabel to show what is happening in terms of connectivity
- tempLabel – This will just display the temperature value read from the SensorTag
To set this up in code, go to your ViewController.swift and declare three variables of UILabel class as follow:
var titleLabel : UILabel!
var statusLabel : UILabel!
var tempLabel : UILabel!
The next step is to set up each of these labels and add them as a subview to the main view. Inside the viewDidLoad() function, add the following chunk of code:
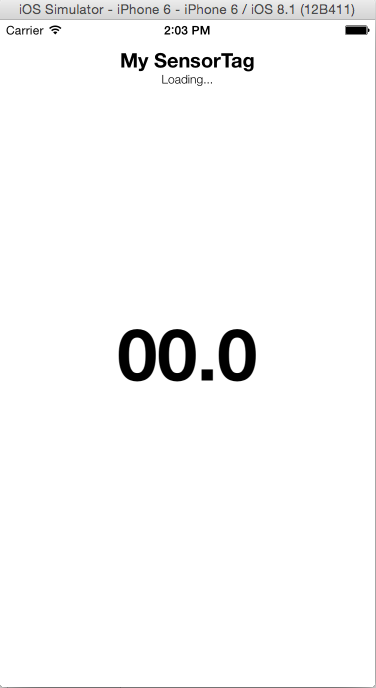
// Set up title label
titleLabel = UILabel()
titleLabel.text = "My SensorTag"
titleLabel.font = UIFont(name: "HelveticaNeue-Bold", size: 20)
titleLabel.sizeToFit()
titleLabel.center = CGPoint(x: self.view.frame.midX, y: self.titleLabel.bounds.midY+28)
self.view.addSubview(titleLabel)

// Set up status label
statusLabel = UILabel()
statusLabel.textAlignment = NSTextAlignment.Center
statusLabel.text = "Loading..."
statusLabel.font = UIFont(name: "HelveticaNeue-Light", size: 12)
statusLabel.sizeToFit()
statusLabel.frame = CGRect(x: self.view.frame.origin.x, y: self.titleLabel.frame.maxY, width: self.view.frame.width, height: self.statusLabel.bounds.height)
self.view.addSubview(statusLabel)

// Set up temperature label
tempLabel = UILabel()
tempLabel.text = "00.00"
tempLabel.font = UIFont(name: "HelveticaNeue-Bold", size: 72)
tempLabel.sizeToFit()
tempLabel.center = self.view.center
self.view.addSubview(tempLabel)
All that is happening in the code above is that, one at a time, each UILabel is being initialised, its font is set and the label’s position in the frame defined. The end result will look as shown below.
The CoreBluetooth Framework
Import the CoreBluetooth Framework in your project by adding the following statement to the top. This provides access to all the classes and methods needed to access the Bluetooth radio on an iOS device.
import CoreBluetooth
The ViewController must conform to the CBCentralManagerDelegate and CBPeripheralDelegate protocols. The former allows monitoring and discovery of BLE peripheral devices and methods to call when a connection is established or dropped. The latter allows discovering the services and characteristics of a peripheral device (sensor) and get updated values from it. To conform to these protocols, add them to the class declaration line of ViewController. It should look like this:
class ViewController: UIViewController, CBCentralManagerDelegate, CBPeripheralDelegate
Add the two lines of code below to declare two properties of the ViewController. CBCentralManager object is used to manage the discovered sensors. In this case that will be a SensorTag (also known as a peripheral) and represented by the CBPeripheral object.
// BLE
var centralManager : CBCentralManager!
var sensorTagPeripheral : CBPeripheral!
Initialize the centralManager inside viewDidLoad() as follows by setting self as its delegate.
// Initialize central manager on load
centralManager = CBCentralManager(delegate: self, queue: nil)
At this point we have set up all the properties we need and the user interface. The next step is to implement the delegate methods for both CBCentralManagerDelegate and CBPeripheralDelegate. Before that, lets take a very quick overview on what we are actually trying to achieve and how it will be done.
Before scanning for BLE peripherals in the vicinity we should check whether Bluetooth on the hardware (iPhone/iPad) is switched on and is available for use. Once we can confirm that we start scanning. What happens during the scan? The peripherals keep on transmitting small bytes of advertisement data which allows the central device to identify them. So when we start scanning, a delegate method gets called for each peripheral device found. What we have to do is check the device’s advertisement data to identify it. Once we have identified our desired peripheral, we stop scanning and issue a command to connect to this peripheral. On establishing a connection, we query the sensor for a list of its services. In this case, for example, the SensorTag has service profiles for IR Temperature, Accelerometer, etc. For the service that we need, we then discover its characteristics, such as enable register, data value, time interval, etc. Finally we will enable the sensor to start sensing and subscribe to its notifications such that we receive a data value after a set time period.
This was a very quick summary of what we are going to implement next. To understand the Core Bluetooth framework in more detail, have a look at his fantastic tutorial: http://www.raywenderlich.com/52080/introduction-core-bluetooth-building-heart-rate-monitor.
Define BLE Constants
The BLE peripheral services and characteristics are identified using their UUIDs. For SensorTag, these are defined in the user guide. Define these as constant CBUUID objects and we will be using them later.
// IR Temp UUIDs
let IRTemperatureServiceUUID = CBUUID(string: "F000AA00-0451-4000-B000-000000000000")
let IRTemperatureDataUUID   = CBUUID(string: "F000AA01-0451-4000-B000-000000000000")
let IRTemperatureConfigUUID = CBUUID(string: "F000AA02-0451-4000-B000-000000000000")
Now lets implement the delegate methods to perform each of the aforementioned functions. We will also update the statusLabel so that the status is shown in the view whenever each function gets called.
Check the BLE Hardware Status
This is done using centralManagerDidUpdateState delegate method. If the state of CBCentralManager object is PoweredOn we will start scanning for peripheral devices and update the statusLabel text to show the same. The CBCentralManager state can be PoweredOff or Unknown or even Unsupported so feel free to have a different error message for each if you need.
// Check status of BLE hardware
func centralManagerDidUpdateState(central: CBCentralManager!) {
if central.state == CBCentralManagerState.PoweredOn {
// Scan for peripherals if BLE is turned on
central.scanForPeripheralsWithServices(nil, options: nil)
self.statusLabel.text = "Searching for BLE Devices"
}
else {
// Can have different conditions for all states if needed - print generic message for now
println("Bluetooth switched off or not initialized")
}
}
Discover Peripherals To Find SensorTag
Now we check the advertisement data of each peripheral that the central manager finds. This is done using the didDiscoverPeripheral delegate method which gets called for every peripheral found. Implement the method as below.
// Check out the discovered peripherals to find Sensor Tag
func centralManager(central: CBCentralManager!, didDiscoverPeripheral peripheral: CBPeripheral!, advertisementData: [NSObject : AnyObject]!, RSSI: NSNumber!) {

let deviceName = "SensorTag"
let nameOfDeviceFound = (advertisementData as NSDictionary).objectForKey(CBAdvertisementDataLocalNameKey) as? NSString

if (nameOfDeviceFound == deviceName) {
// Update Status Label
self.statusLabel.text = "Sensor Tag Found"

// Stop scanning
self.centralManager.stopScan()
// Set as the peripheral to use and establish connection
self.sensorTagPeripheral = peripheral
self.sensorTagPeripheral.delegate = self
self.centralManager.connectPeripheral(peripheral, options: nil)
}
else {
self.statusLabel.text = "Sensor Tag NOT Found"
}
}
The TI SensorTag is identified by checking the object for its local name key. The advertisementData is an NSDictionary Object and we look for the NSString value at the key CBAdvertisementDataLocalNameKey (which is an optional since it may or may not exist). If the value is SensorTag, the statusLabel is updated to indicate that a SensorTag is found and the scanning for devices is stopped. The found peripheral is then set as the CBPeripheral object we will use and set its delegate as self before attempting to connect to the peripheral.
Connection to a Peripheral
The delegate method didConnectPeripheral gets called when a successful connection with the peripheral is established. On connection, we will call the peripheral method discoverServices() and update the statusLabel text as shown below.
// Discover services of the peripheral
func centralManager(central: CBCentralManager!, didConnectPeripheral peripheral: CBPeripheral!) {
self.statusLabel.text = "Discovering peripheral services"
peripheral.discoverServices(nil)
}
Discovering Peripheral Services
The services of a peripheral can be identified by their UUIDs. The different service UUIDs for SensorTag can be found here and also in the user guide. We will check the UUID of each service of the peripheral and compare it against IRTemperatureServiceUUID which we defined earlier. When the service is found we will explore its characteristics. You can try and print all the different service UUIDs in the console to see what other services are being offered by the peripheral by uncommenting the last line of the code below.
// Check if the service discovered is a valid IR Temperature Service
func peripheral(peripheral: CBPeripheral!, didDiscoverServices error: NSError!) {
self.statusLabel.text = "Looking at peripheral services"
for service in peripheral.services {
let thisService = service as CBService
if service.UUID == IRTemperatureServiceUUID {
// Discover characteristics of IR Temperature Service
peripheral.discoverCharacteristics(nil, forService: thisService)
}
// Uncomment to print list of UUIDs
//println(thisService.UUID)
}
}
Discovering Characteristics and Enabling Sensor
In the above method, we called the discoverCharacteristic() function when IR Temperature service was found. As a result the didDiscoverCharacteristicsForService method of CBPeripheralDelegate protocol gets called. The code below shows how to implement this delegate method.
// Enable notification and sensor for each characteristic of valid service
func peripheral(peripheral: CBPeripheral!, didDiscoverCharacteristicsForService service: CBService!, error: NSError!) {
// update status label
self.statusLabel.text = "Enabling sensors"
// 0x01 data byte to enable sensor
var enableValue = 1
let enablyBytes = NSData(bytes: &amp;enableValue, length: sizeof(UInt8))
// check the uuid of each characteristic to find config and data characteristics
for charateristic in service.characteristics {
let thisCharacteristic = charateristic as CBCharacteristic
// check for data characteristic
if thisCharacteristic.UUID == IRTemperatureDataUUID {
// Enable Sensor Notification
self.sensorTagPeripheral.setNotifyValue(true, forCharacteristic: thisCharacteristic)
}
// check for config characteristic
if thisCharacteristic.UUID == IRTemperatureConfigUUID {
// Enable Sensor
self.sensorTagPeripheral.writeValue(enablyBytes, forCharacteristic: thisCharacteristic, type: CBCharacteristicWriteType.WithResponse)
}
}
}
First we update to statusLabel for some visual benefit and then define 0x01 as a constant. Then we need to enable the sensor notification for the data characteristic and enable the sensor itself by writing to the config characteristic. More details on this can be found in the SensorTag user guide.
To enable the IR Temperature sensor we need to find the IR Temperature Config service (identifiable via its UUID) and then write a value of 0x01 to it. Once this is done the next delegate method gets called every time there is an updated data value to read from the sensor.
Getting Data Values from the Sensor
Now that we have subscribed to the sensor notifications (for data characteristic) the didUpdateValueForCharacteristic delegate method gets called every time we have to read a value from the sensor. We first check if this is a valid IR Temperature data characteristic (using its UUID) and read the value from this characteristic. For IR Temperature service this data is in the form:
ObjectLSB:ObjectMSB:AmbientLSB:AmbientMSB
For the ambient temperature we the corresponding 16 bits. So for example we get a value of 0xADFF800B the raw value will be written as 0B80 which needs to be divided by 128 to get the ambient temperature. For calculating the object temperature and other sensor values refer to the user guide where all algorithms are nicely explained. If you want these in Swift, refer to my Github project SwiftSensorTag which has most of these algorithms implemented in Swift.
For IR Temperature data characteristic, we therefore convert the bytes to signed 16 bit array of integers, divide the value by 128 which is the ambient temperature and display on the main view by assigning the value to tempLabel.
// Get data values when they are updated
func peripheral(peripheral: CBPeripheral!, didUpdateValueForCharacteristic characteristic: CBCharacteristic!, error: NSError!) {
self.statusLabel.text = "Connected"
if characteristic.UUID == IRTemperatureDataUUID {
// Convert NSData to array of signed 16 bit values
let dataBytes = characteristic.value
let dataLength = dataBytes.length
var dataArray = [Int16](count: dataLength, repeatedValue: 0)
dataBytes.getBytes(&amp;dataArray, length: dataLength * sizeof(Int16))
// Element 1 of the array will be ambient temperature raw value
let ambientTemperature = Double(dataArray[1])/128
// Display on the temp label
self.tempLabel.text = NSString(format: "%.2f", ambientTemperature)
}
}
That’s about it really. One more delegate method which would be nice to implement is to define the behaviour when the peripheral gets disconnected.
Disconnection From a Peripheral
This is a very simple method and all it does is that when SensorTag is disconnected, for whatever reason, it updates the statusLabel to say that is the case and then starts scanning again for BLE devices.
// If disconnected, start searching again
func centralManager(central: CBCentralManager!, didDisconnectPeripheral peripheral: CBPeripheral!, error: NSError!) {
self.statusLabel.text = "Disconnected"
central.scanForPeripheralsWithServices(nil, options: nil)
}
Build and Run
Build and run the project on an actual iOS device and, if you have followed everything carefully, you should see something like this on your device (screenshot from an iPhone 6).

You can download the complete source file for this project here. If you encounter any problems with this please feel free to ask in the comment section.
Useful Links
- SwiftSensorTag on Github: Check out this project for a complete implementation of SensorTag interface using Swift
- SensorTag User Guide: http://processors.wiki.ti.com/index.php/SensorTag_User_Guide
- SensorTag Attributes Table (for all the UUIDs): http://processors.wiki.ti.com/images/a/a8/BLE_SensorTag_GATT_Server.pdf
- Introduction To Core Bluetooth on RayWenderlich for a great tutorial and understanding of CB framework

Key Trends in Biomedical Engineering : A look back at EMBC 2014
Biomedical Engineering (BME) is one of the hottest and fastest growing subject in engineering at present. It is sometimes painted as a an emerging field or something that has come to the fore very recently. I rather think that biomedical engineering has existed for a long time. Everything from the invention of surgical scissors, x-ray machines and stethoscope could be brought under the umbrella of biomedical engineering (some may call that clinical engineering). It is perhaps impossible to agree on the definition of biomedical engineering but what all would agree upon is that this field draws experts from a range of other conventional science and engineering fields. These include biologists, chemists, mechanical engineers, electrical engineers, statisticians and many more. Universities are also increasingly offering specialised degrees in BME stringing together curriculum covering bits and pieces from all these conventional fields.
Although the field of BME has existed in different forms for many years, the tremendous exponential growth it has seen over the last few years is unprecedented. I believe that this has been made possible due to vast and cheap computing powers available within our pockets. Gone are the days when you’d have to book time on a computer situated 100 miles away to do a certain simulation with the help of someone who was trained to use that beast of a machine (Of course, I wasn’t part of that great era and I have only read such stories). These days we have multicore computers and servers available in every R&D lab to do all the number crunching which has made possible the analysis of vast amounts of data. The other important contributor to BME’s growth is the availability of miniaturised ultra low power (ULP) sensors that can be hooked on to someone for long term monitoring – otherwise known as wearable devices. Better design techniques, low power circuits, improvements in battery technology and wireless connectivity have made it possible for us to record long term data and make sense our of it with our vast computing resources.
Research in BME is being conducted in all parts of the world – some countries more advanced than the others. Numerous meetings and conferences bring together the researchers and scientists from different parts of the world where they share results of their recent work. The largest annual conference to discuss the advancements in BME is EMBC (Engineering and Medicine in Biology Conference) – hosted by the EMB (Engineering and Medicine in Biology) Society of IEEE. It is the place to be to get an insight in to current trends and future directions biomedical research. This year, EMBC was held in Chicago and featured over two thousand papers produced from the works of around seven thousand different researchers and scientists.
Why this Analysis?
Being the largest gathering of biomedical engineers and researchers, analysing the works presented at EMBC gives a glimpse in to the current trends in this exciting area. From the list of all papers presented at the conferences, a keyword analysis can be performed to see what’s the hottest subject within the domain of biomedical research. We can also deduce the regions and countries of the world that are leading biomedical research and deduce others which are only getting started. This analysis can be useful for anyone in the area of biomedical engineering and research to understand the key areas of research and development, countries where the field is more established thereby having more job opportunities and perhaps extrapolate the results to deduce the future trends within BME.
Methodology
The data source used for this analysis is the official EMBC 2014 programme available at http://embc.embs.org/2014/. This doesn’t account for the no-shows at the conferences which would later be removed from the proceedings. However, the assumption here is that the number of no-shows is small enough to make any impact on the final results.
The conference sessions spanned over a period of four days and the detailed programme of each day was listed online. The information included the session name, paper title, author name(s) and their affiliation(s). The HTML source of each day’s schedule was parsed using Python and information about each paper extracted to create a database. This resulted in a comprehensive relational database that includes a list of all papers presented, authors of each paper and affiliation of each author (while the session name was deliberately ignored). From the list of affiliations, another table was created to assign a country to each affiliation where they are based in. A number of challenges arose during this process:
- Some of the affiliations were improperly formatted e.g. rather than an institution name, the affiliation field said Graduate Research Assistant in a certain case.
- Some organisations are based in different countries so a question arises of whether there headquarter location should be used or the office location where the work is being done.
- Some affiliations used acronyms that aren’t well known outside their countries.
For each of these cases and several others where affiliations weren’t clear, the public LinkedIn profiles, Google Scholar profiles and the official research pages of the authors were used to determine the country of the organisation they are affiliated to. This was a cumbersome task and required careful manual verification.
Popular Topics in Biomedical Engineering Research
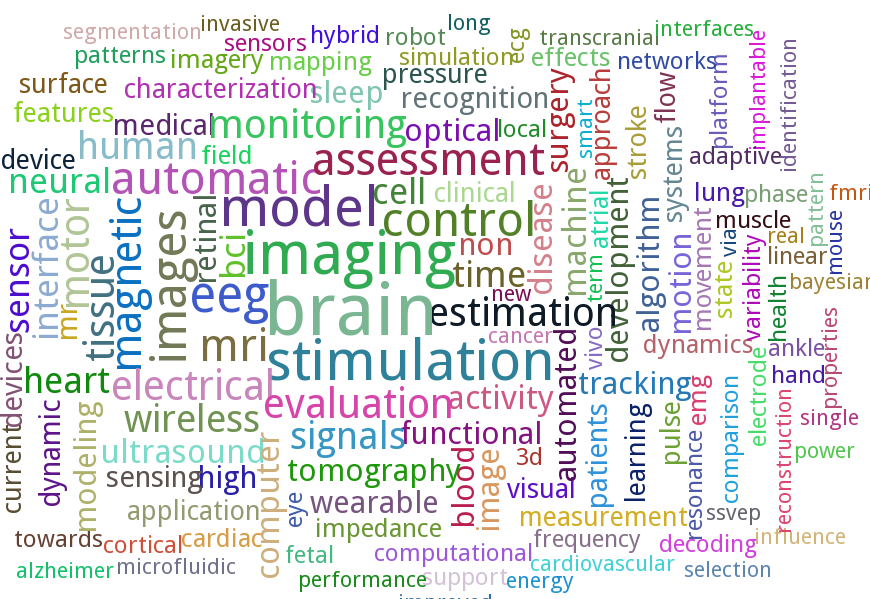
The field of BME is a very vast one that covers engineering in various aspects of human biology. The great range of topics covered at EMBC is therefore unsurprising. However, as in all fields there are areas that receive more attention than the others due to their urgency, complexity and/or popularity. To find out the more popular research topics within the realm of BME I created a word cloud from the titles of all the papers presented at EMBC 2014. This was done using the wonderful PyTagCloud package.
The word cloud shown below reveals that the word brain was used in the paper titles the most times (excluding the stop words of course). It also shows “eeg”, “transcranial”, “neural”, “bci” and “cortical” that are related to the brain. So it can be safely concluded that, at present, the brain is the hottest area of research in biomedical engineering. The other popular areas include heart, wireless, wearable and sleep. Other words such as automatic, monitoring, assessment and model suggest the nature of work being done within various application areas.
Biomedical Engineering Around The World
EMBC is not only the largest gathering of Biomedical Engineers but it is also truly international bringing in top minds from around the world together on one platform. By finding out the country of the affiliation of each author it was possible to determine the different countries that were represented at the conference. This doesn’t include the non-presenting attendees who may be from other countries as well. Finally, some authors presented multiple papers at the conference so they are counted multiple times because what is being ascertained here is the research output from every country.
The world map below shows the research output from each country. In total, the authors were represented from 62 different countries. A quick glance on the map shows, unsurprisingly, that the highest number of authors were from the US. The top five countries in descending order are USA, Japan, China, Canada and United Kingdom. These countries have many established research centres so it is not a surprise to see a large output from them, however it is great to see increasing levels of research output from developing countries. In terms of different regions, Japan takes the lead in Far East Asia followed by China, Brazil and Mexico in South America, India in South Asia, United Kingdom in Europe followed closely by Italy and France, Iran and UAE in Middle East and Egypt in Africa.
made with ChartBoot
Number of Papers & Authors at EMBC 2014
Finally, I also looked at the most prolific authors at EMBC 2014 i.e. the authors who produced the maximum number of papers. The total number of papers listed in the conference programme were 2184 with 9502 authors across them (including authors who had multiple papers), so that gives a mean average of 4.35 (median average is 5) authors per paper, and the maximum of 19 authors for one paper. Since the authors per paper vary greatly across different research disciplines, this number can be used as an indicator of the trend in biomedical engineering research. The distribution of the number of authors per paper is shown in the chart below.
Of the 9502 authors listed across all the paper, 7019 were unique. From these, I looked at which authors (co)authored the maximum number of papers. The result was a tie with Nitish Thakor (John Hopkins University, USA) and Hung T. Nguyen (University of Technology, Sydney, Australia) both featuring on twelve papers.
Conventionally the main contributor of a paper is often named as the first author (although it may not be the case in certain countries). So I further looked at how many authors presented what number of papers as first authors. From the 2013 unique first authors, Gaetano Valenza (University of Pisa, MGH, Harvard Medical School) had the maximum of five papers as a first author.
A similar analysis for the last authors (a slot conventionally reserved for PIs) of the papers revealed 1544 unique last authors. Of them, 13226 from Hung T. Nguyen (University of Technology, Sydney, Australia) featured as the last author on ten papers which is the maximum.
Conclusion
The analysis performed here shows some important results but is by no means comprehensive. It currently shows the popular topics in biomedical research as well as the spread of different authors across the globe. It can be further extended to cover a gender analysis to see what is the male/female ratio of biomedical researchers overall and in different regions of the world. The affiliations of authors can be further analysed to study what proportion of authors came from academic institutions and from industrial organisations. Another interesting bit of data to look at would be the age range of authors to determine how many early career or established researchers were represented. Finally, the extent of cross-border collaboration could also be studied by establishing how many papers were authored by researchers from multiple countries. In future, performing similar analysis of EMBC every year can help us understand these key trends in biomedical research in a much better way.

Adding Figures to LaTeX Manuscripts
One common complaint is that LaTeX is not image-friendly and is somewhat true. Depending on the workflow being used the format of the image is quite important. I am by no means an expert in TeX and have only compiled this information searching through forums whenever stuck on a certain problem. I must confess that despite the initially steep learning curve (compared to Word and others), I am pleased that I kept carrying on using LaTeX because the end result is absolutely beautiful!
If you are using pdflatex for compiling then there are more options such as JPG, PDF, EPS, PNG. If using latex, then your only choice is using the EPS format. My workflow is LaTeX -> DVI -> PDF so all images are in EPS format. I’d suggest using vector graphics (PDF or EPS images) anyway because they scale nicely unlike JPG images.
Because I am constrained to using EPS images I have to convert the files if they are in any other format – and this happens very often. At first this was frustrating but after couple of years of using the same workflow I think I have settled in nicely. On my Windows machine I use TeXnicCenter while on my Mac I have a script that compiles using latex in pretty much the same way.
When I am creating a flowchart or block diagram of something I prefer using Adobe Illustrator of Microsoft Visio. Illustrator allows me to save as EPS directly and with Visio I save the file as PDF (more on PDF to EPS conversion later).
My plots and graphs are generated using Matlab which allows me to use the excellent LaPrint function directly. This function will save two files, an EPS image and a TEX file, the latter will need to be sourced in your main manuscript (see below for example).
For any other image files I save them as PDF using Preview in OS X (I am sure it can be saved as easily on Windows too).
This is the part that is not so easy unless you have Adobe Acrobat Professional. I open all my PDFs in Acrobat Professional and just export them as EPS. I haven’t looked yet if there is a way of automating this with a script but that would make the whole process of JPG->PDF->EPS much quicker.
If you don’t have Acrobat Professional I think you’re better off using pdflatex with PDF images.
To insert the figure in your paper, first you need to add this to your preamble:
\usepackage{graphicx}
For Matlab generated plots using LaPrint, you will also need the psfrag package (you can read more about it here) and the color package to add colour to your text.
My preamble looks like this with all three packages:
\usepackage{graphicx,psfrag,color}
And now to insert a figure in the manuscript you just need to use \includegraphics{} :
\begin{figure}
\centering
\includegraphics[width=0.45\textwidth]{figure_name.eps}
\caption{Caption of the figure.}
\label{fig:label}
\end{figure}
I add the \centering tag because it looks nicer when figures are centered! And the width is set to 0.45*textwidth to keep it just within the margin of a two-column paper where each column is half of the total text width.
Note that if you want the figure to span both the columns of a two-column paper you don’t need to point your cursor to the edge of the figure, resize it, realign it and then work with the text around it (as you’d do with MS Word, for example). Just add an asterik to the end of figure begin and end, as below:
\begin{figure*}
\centering
\includegraphics[width=0.45\textwidth]{figure_name.eps}
\caption{Caption of the figure.}
\label{fig:label}
\end{figure*}
The files generated using LaPrint for Matlab figures can be easily sourced in using the following code:
\begin{figure}
\centering
\input{matlab_figure.tex}
\caption{Matalb figure caption.}
\label{fig:label}
\end{figure}
That’s all quite easy but what about subfigures? Exactly the same procedure, with the addition of using the subfigure package.
\usepackage{subfigure}
In the body of the manuscript, the following code will generate five subfigures, two on each of the first two lines and one on the last one, all centered, spanning the two columns.
\begin{figure*}
\centering
\subfigure[]{\label{fig:fr1}\includegraphics[width=0.48\textwidth]{images/sp1.eps}}
\subfigure[]{\label{fig:fr2}\includegraphics[width=0.48\textwidth]{images/sp2.eps}}
\subfigure[]{\label{fig:fr3}\includegraphics[width=0.48\textwidth]{images/sp3.eps}}
\subfigure[]{\label{fig:fr4}\includegraphics[width=0.48\textwidth]{images/sp4.eps}}
\subfigure[]{\label{fig:fr5}\includegraphics[width=0.48\textwidth]{images/sp5.eps}}
\caption{Five subfigures!}
\label{fig:subfigure_example}
\end{figure*}
I am pretty sure there is a package that allows rotating images very easily but I can’t be bothered to look for it. For quite some time now, I rotate the image beforehand in Preview (or any other image viewer) before inserting it in my manuscript. I find this much easier but feel free to search if you want a more TeX-y solution.
That’s pretty much all about adding images. In the coming weeks I will post about inserting tables and equations and some tips and tricks that I’ve collected over the years that is helpful when writing papers and theses.
Cover Image Source: The Unconditional Blog

How to tackle a major revision
Now that you’re finally over the disappointment of receiving a major revision (and not a rejection!) on your cherished paper, it’s time to start working. My strategy is based on Tanya Golash-Boza’s post and is modified slightly to suit my workflow. The use of a spreadsheet may sound crazy to some (it did to me!) but it really helps to see things visually and chances of missing something are greatly minimised.
Step 1: Keep Calm and Read the Comments
As I mentioned in the last post, read the all the comments made by the reviewers and the associate editor without any bias or emotion to get a sense of what they require of you. If your supervisor has read the comments too then get a feel of what he or she thinks. It is quite likely that they may spot something that you’ve missed (based on their experience).
Step 2: List the revisions in a spreadsheet
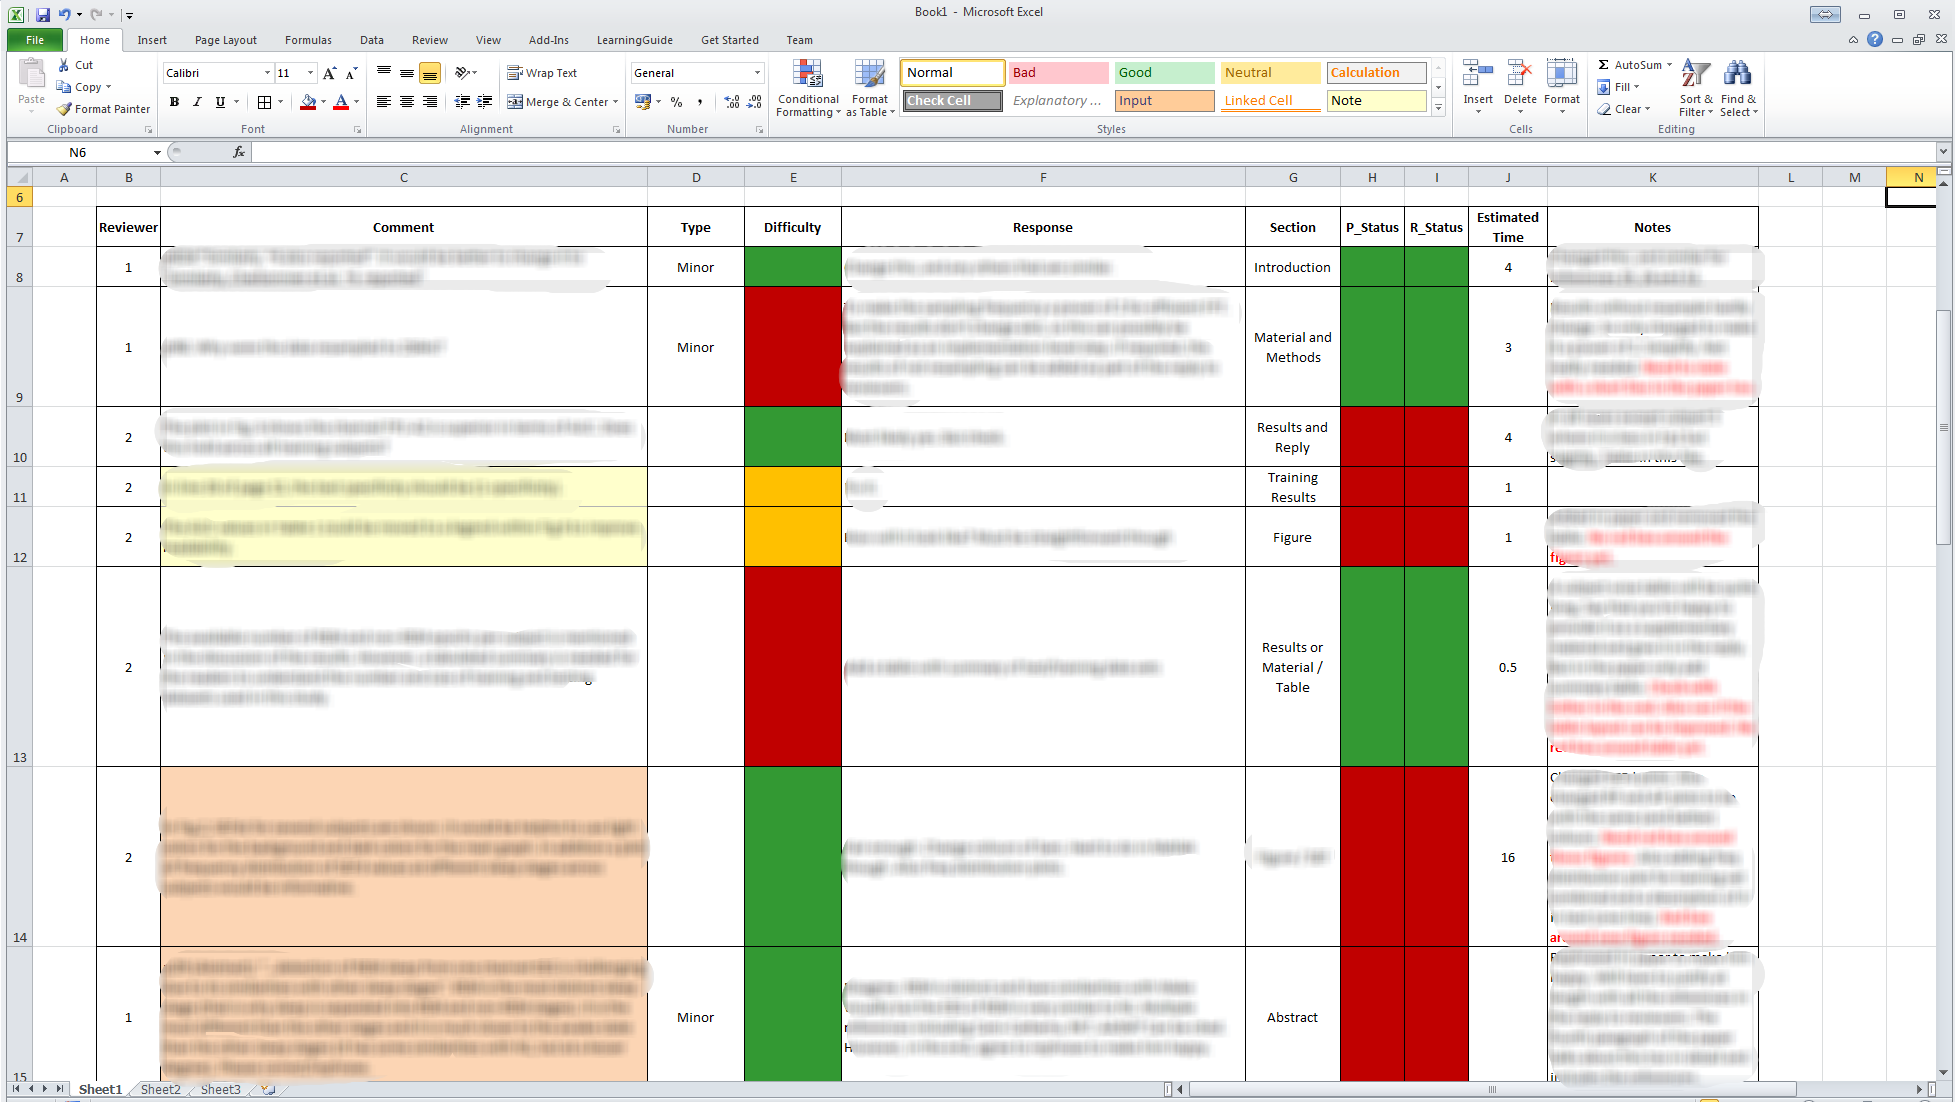
Following Tanya’s suggestion, make a spreadsheet to list all the revisions, one comment per row. Also wrap the text in the cell otherwise its hard to follow long comments. I use the following columns in my spreadsheet (few more than her) that are explained below:
- Reviewer: ID of reviewer i.e. 1,2,3, etc. or AE (for associate editor).
- Comment: Reviewer’s comment. I paste it exactly as it is so that I get to read it multiple times (regardless of how heartbreaking and mean it may be). This also helps me to ensure I haven’t missed anything and understand the comment more clearly.
- Type: Whether the comment is major or minor. Helpful when reviewers say it themselves.
- Difficulty: I colour code this as green, orange or red depending on the relative effort required to answer the comment. Sometimes a major revision requires less effort than a minor comment!
- Response: My initial response to a particular comment.
- Section: Which section in the paper will this be addressed in?
- P_Status: Status of changes made in the paper. Traffic light colour coding with red for not started, orange for in progress and green for finished.
- R_Status: Status of reply in the response letter to reviewers. Colour coded as above.
- Estimated Time: Roughly approximate number of hours/days needed to address a reviewer’s comment.
- Notes: Any extra notes related to this particular comment.
Step 3: Find links between comments
Some issues may have been flagged by multiple reviewers that are exactly the same. There may be multiple comments by the same reviewer as well that are saying the same thing essentially. I colour the cells of these comments on my spreadsheet using very light colours (different for each comment, but one colour for the group).
Step 4: Rearrange the rows
I’d usually put the easier bits on top. These are the rows with green/orange cells in the Difficulty column. But you’re free to choose any order you’re comfortable with. When rearranging make sure all the columns are correctly moved up or down. Also put the linked comments next to each other (same coloured rows). My final spreadsheet looks something like this:
Step 5: Estimate total time
This is essentially summing up the time column to see what your next couple of months are going to look like. If you’re sure you need more time then there’s no harm in asking for an extension. I find this step really important because it gives me an instant idea of whether I can delay my work on the revisions or not.
Step 6: Frame the response for each comment
In the response column, write detailed notes on how you’re going to answer each comment made by the reviewer. I use this column first to put my initial thoughts about every comment.
Step 7: Go green!
The red cells in the status column need to go green! The way I work is that I first make the change in the paper and change its status in the spreadsheet. I also write a proper reply to a particular reviewer’s comment at the same time in a different file.
Step 8: Review
This is the most boring part. Once all the red status cells are green, make sure that the changes you’ve made actually make sense. Get someone to read, if possible. Check the grammar too. Ensure you have made all the changes in the paper and have a corresponding response for each change. If you disagree with something, you must justify it very clearly.
Step 9: Submit
And wait, for the good news!

Major Revision? It’s NOT a bad decision!
I’ll be very honest here. It sucks to get a Major Revision (or Revise and Resubmit) on any manuscript. It really does! An optimist would say that its better than an outright Reject. That’s true but the amount/nature of work a major revision can entail is usually unpredictable. Also, by the time you get the reviews back, you’ve probably moved on to something more interesting. You are then dragged back in time where the first task is to locate the files you used to create the final version manuscript in the first place. Its horrible. Add to that, you can be given anything between a month to six months to make the revisions and submit it.
So what should you do when you receive that long e-mail full of hurtful comments asking you to make major changes to the manuscript?
Well, to start with, if you’re having thoughts of not revising it then get rid of them. The fact that your paper wasn’t rejected indicates that there is some merit in it and is a very very small acknowledgement of your work. Following that, take time in reading the comments. There is no hurry. In fact the first couple of times you read the comments you’ll be pretty pissed and think that the reviewer is either crazy, being mean or just doesn’t understand your work. Either can be true, of course. But when two or three reviewers are raising some points then be open to accept that there is something that needs attention. What I have started doing now is to read the comments quickly and then forget about it for a day. This is because my first reaction to comments is always clouded by the disappointment in getting a major revision. The trick here is to read them objectively, without any emotion. This is hard too, because you’re almost always emotionally attached to your work. In your mind, your research is great and you just see the positives in it. But whether you have expressed it in the same way as it is in your head is always a big question mark.
I really cannot stress how important it is to read the comments over and over again to understand what they exactly ask of you. I once prepared a detailed reply to a comment only to realise later that I misunderstood it. Some comments may even sound mean or dumb. But think about it, what if the reviewer is asking something only out of curiousity? Something that will add value to your paper, making it more informative to the reader? Just because you understand your paper doesn’t mean anyone who reads it will understand it. Also, the reviewer doesn’t have anything personal against you. Even if he or she does, you can’t really find it out!
Having said that, try to address ALL of the issues raised by the reviewers. Unless you have a very strong reason not to do so, and the reason should be sufficiently explained, just make the changes that they have asked for. It may change the outlook of the paper somewhat, and probably, for better. Also, it is likely that the same reviewers will have a look at your revisions so if you do make the changes based on their suggestions they will be happy to let it through – unless there is something wrong.
Finally, it may turn out that only one of the reviewers think your manuscript needs a major revision while others consider it close to being ready for publication. From my experience, you can tell that from the tone of the comments made by each of the reviewer. This will help in estimating the time needed to make the changes. If they are minor then they don’t warrant spending a lot of time. Most journals will assign a decision of major revision if at least one of the reviewers think that major work is needed (this link gives a good idea about how the final decision is made). So if you think only one of the reviewer may have given you a major revision then you’re pretty close to crossing the line. Even if not, there is no reason to be disappointed because you already have a foot in the door and all you need is a little bit of motivation to make the required changes.
I know…easier said than done.
In the next post, I will write about the strategy I follow in tacking a major revision.

The First Academic Paper Experience
The anxiety of waiting for a decision on your first ever academic paper is unbearable. It starts immediately after you hit that submit button and ends up when you receive THAT email. While writing that first paper you’ve most likely ensured that everything is clearly explained and justified. And your supervisor, who is a big name in your field, has also given it a green signal so chances of it not getting accepted is pretty low, right? Wrong.
A lot of things can go horribly wrong – or let’s just say not according to your dream plan. Let’s start with that e-mail.
When I got a big fat rejection (BFR) e-mail for my first paper I was pretty disappointed, to say the least. Because the publisher is based in the US I read the e-mail sometime in the middle of the night and didn’t manage to sleep thereafter. This was unexpected. This was a new territory that I hadn’t experienced before. I had already planned to add the first paper to my CV and dreamt of numerous citations within few months.
I woke up, still in shock, and fired up my MacBook to read that email clearly. The short story is that the reviewers weren’t happy with the work and had raised some points which I found unreasonable and unsubstantiated. Of course I couldn’t see their logic. They were wrong and biased and there was no other explanation. I forwarded the e-mail to my supervisor and then couldn’t sleep despite repeated attempts. I cleared my head and toyed with the possibility of there being some reason in reviewers comments. I concluded it was my writing style that failed to convince them and I ended up buying 3 books on how to write an academic paper and reading one entirely that day (skipping work).
Next day, I decided to read that email again with one change – not being emotional about my work. I decided to see it from from the reviewers’ point of view and immediately saw some shortcomings (not all, mind you). Many comments were useful, some showed arrogance and a few ignorance too. I discussed all of them with my supervisor in detail and it was decided to submit it in a different journal for publication – making some improvements based on the review (that made sense to us).
Guess what? I got another BFR! This was disappointing too – but not as bad as the first time. The horrible thing with these is that you get the decision 3-4 months after submission and have moved on to doing something else by that time. Anyway, this time there was no criticism of the work. The reason for rejection was that the paper was somewhat out of scope of the journal. We had already anticipated that before submission but then there were similar papers published recently that guided our decision.
Without any further changes, I sent it to yet another journal. By now I was fed up. I spent about 8 months doing the work that was being presented – cancelling one of my planned holidays, and 10 months had passed since the first submission. Two more months and I received an email with Major Revisions. This was celebrated as progress! I have read somewhere that major revision is the most common decision given to papers (after rejection). I was delighted at first but when I saw the revisions they asked for, I freaked out. It was too much work, very different from what I had been doing in the last 12 months. I had six months to do the revisions. Reluctantly I agreed to do it (was there a choice? maybe) and estimated it would take 3 months of my time. Actually a co-author (and a colleague) on this paper, who is super duper intelligent and highly regarded, convinced me to do it. He drafted a nice reply to the reviewers explaining each of the changes I made. We got another round of minor revisions after submitting the heavily modified versions. These were small changes and by this time I was convinced I have passed the review cycle. Few more days and it was finally accepted. And the feeling of joy I felt made me realise all the effort put in was totally worth it. Although, if it wasn’t for the co-author and the supervisor I’d have given up after first attempt.
Recently I ended up reading the very first draft that was rejected and compared it with the final thing that was accepted after lots of changes. The two are very different. The content may be similar but the changes are definitely for better i.e. clear presentation, useful addition of figures, better introduction, etc. I realised that the end paper was not exactly what we planned initially. The review process had a large influence in its final shape and actually improved it. My view now is that although the review system isn’t perfect and often results in some biased comments it does eventually lead to an improvement in the paper quality (this can easily be disputed).
To all those who haven’t published yet, brace yourselves for an emotional time ahead! The first rejection hurts – badly. And for those who have been rejected, keep trying. The end result is absolutely worth every effort!
Image Source: PhD2Published
WordPress XML Splitter (again!)
In the last eight months or so I’ve been getting plenty of e-mails asking for a copy of the mainSplit.py Python script I wrote ages ago. It basically takes in a large WP backup XML file and splits it in to chunks of less than 2mb. Apparently some tech blogs also linked to the previous website where the script was hosted but since that site is pretty much dead for some time the script also doesn’t exist. The Python script works well with all operating systems but I believe there are other alternatives for Windows users. For Mac users not comfortable with Terminal, I’ve wrapped up the script in an app using Platypus. I am putting up the script back here again together with the OS X app and both these files can be downloaded using the links below.
Python mainSplit.py script
OS X application: WP XML Splitter
(Image Source: Centennial Arts)